
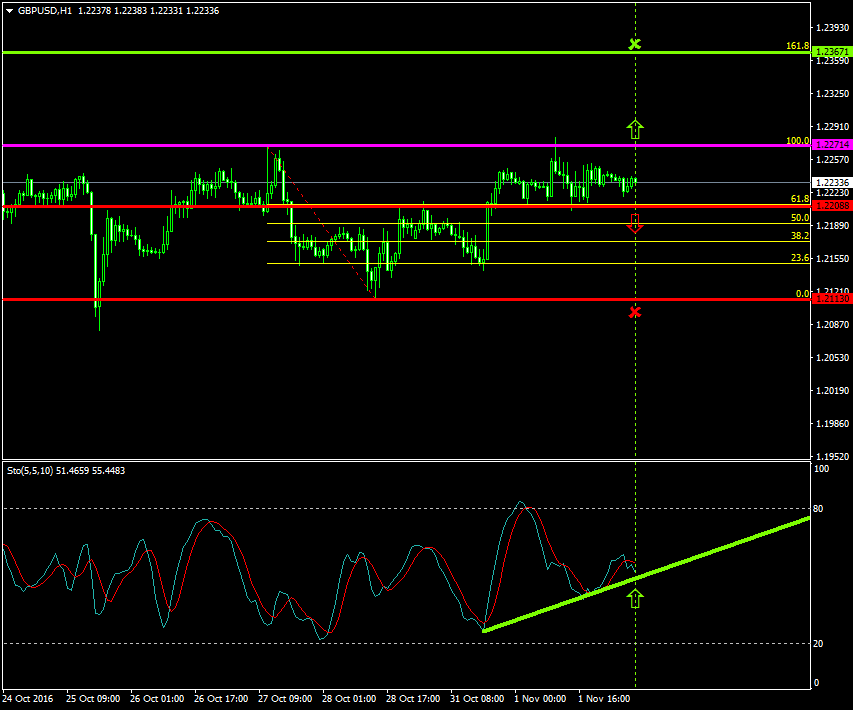
Can the buyers retrace the GBPUSD higher at 1.2271?
The GBPUSD has been mostly oscillating, since the 28th of October 2016, between the range of 1.2113 and 1.2271 respectively.
Both the buyers and the sellers are now placing strong pressures in their attempts of taking control over the pair’s price.
The price is now oscillating close to the 1.2271 zone which is today’s major pivot point area.
Probable Scenario
In the condition where the pair stabilizes above the 1.2271 area, the price could rise to higher zones such as the 1.2367.
The Stochastic oscillator also confirms that the price has greater chances to retrace and rise at the 50 level.
Alternative Scenario
Alternatively, should the sellers withhold the price close to the 1.2208 area Fibonacci’s 61.8%, and thereafter force the pair lower, the price could depreciate as low as 1.2113 Fibonacci’s 0.0%.
Today’s Major Announcements
- The PMI Construction (Oct) release is expected to have a medium influence on the sterling
- The Fed’s Monetary Policy Statement and the Fed Interest Rate Decision releases are expected to have a medium influence on the U.S. dollar
Synopsis
· Probable trend (Bullish): 1.2271
· Bullish take profit target: 1.2367
· Stop loss target: 1.2208
· Alternative trend (Bearish): 1.2208
· Bearish take profit target: 1.2113

Elias Kazamias
Latest posts by Elias Kazamias (see all)
- Foobee Launch Captures Public Imagination - July 10, 2021
- NoBanx Launches in Cyprus - April 28, 2021
- How to Choose the Best Forex Broker? - November 7, 2020